
|
|
Water Vapour Mixing Ratio MeasurementsC. Bryant  Water vapour mixing ratios are meassured using Raman-scattering. Raman-scattering uses the laser beam used in the Rayleigh temperature measurements. Each molecular species has a unique Raman-shifted wavelength. In this way, with a narrow bandwidth filter (we use 1 nanometre filters), one can isolate and measure the returns at that wavelength. For us, water vapour is measured at 660.3 nm and molecular nitrogen at 607.3 nm. What is a mixing ratio and why do we measure nitrogen when we want water vapour? Well, the answer is simple and the questions are linked together. The mass mixing ratio (of a tracer) is the pressure of the tracer over the pressure of the DRY atmosphere multiplied by the molecular mass ratio of the two constituents. Since we want dry air, we can approximate it with nitrogen since the ratio of nitrogen in the atmosphere is constant at 78.1% to about 120 km. The mixing ratio below the tropopause is measured in grams/kilogram (g/kg). Above the tropopause it is often measured in parts per million by volume (ppmv). The conversion is 1 (g/kg) = 1600 * (ppmv). 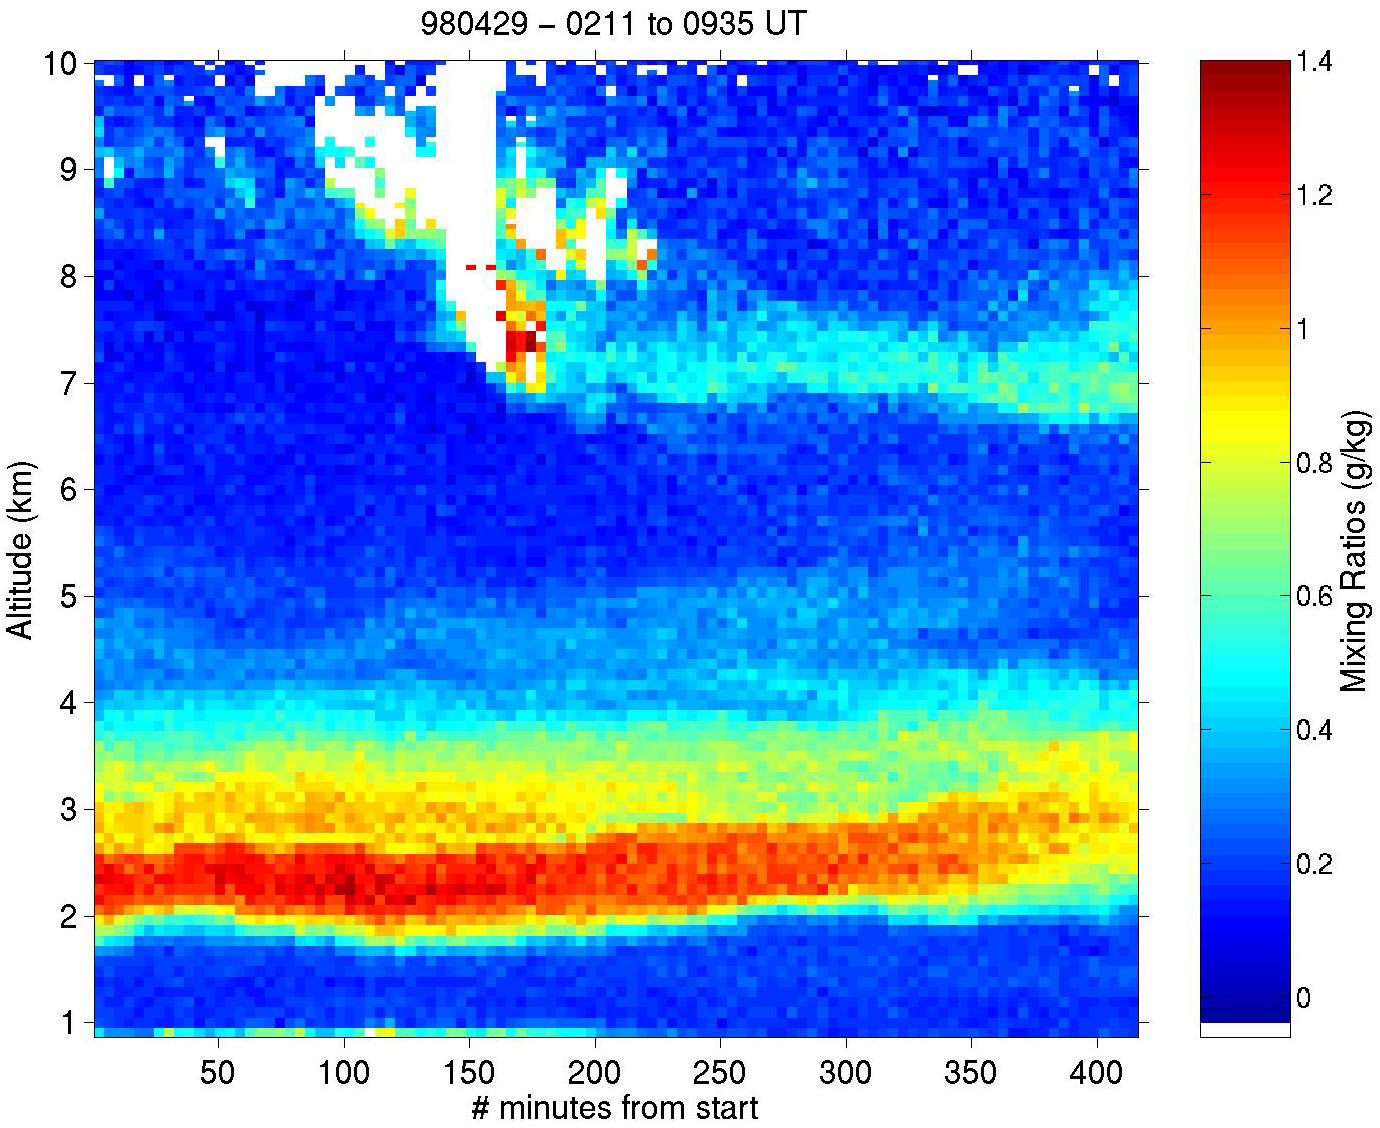 This image is from April 29, 1998. It is one of our preliminary water vapour mearuements using simultaneous collection of molecular nitrogen and water vapour. The plot shows just over seven hours of data and highlights the structure of the water vapour. The region near 9 km and 150 minutes is a cloud and has been removed by an automated algorithm. This algorithm uses the scattering ratios of nitrogen and water vapour when makeing such determinations. This data has no external calibration done yet. However, it is within a factor of two when compared to nearby radiosondes. The resolution is 4 min X 96 m. (click the figure to make it bigger!) 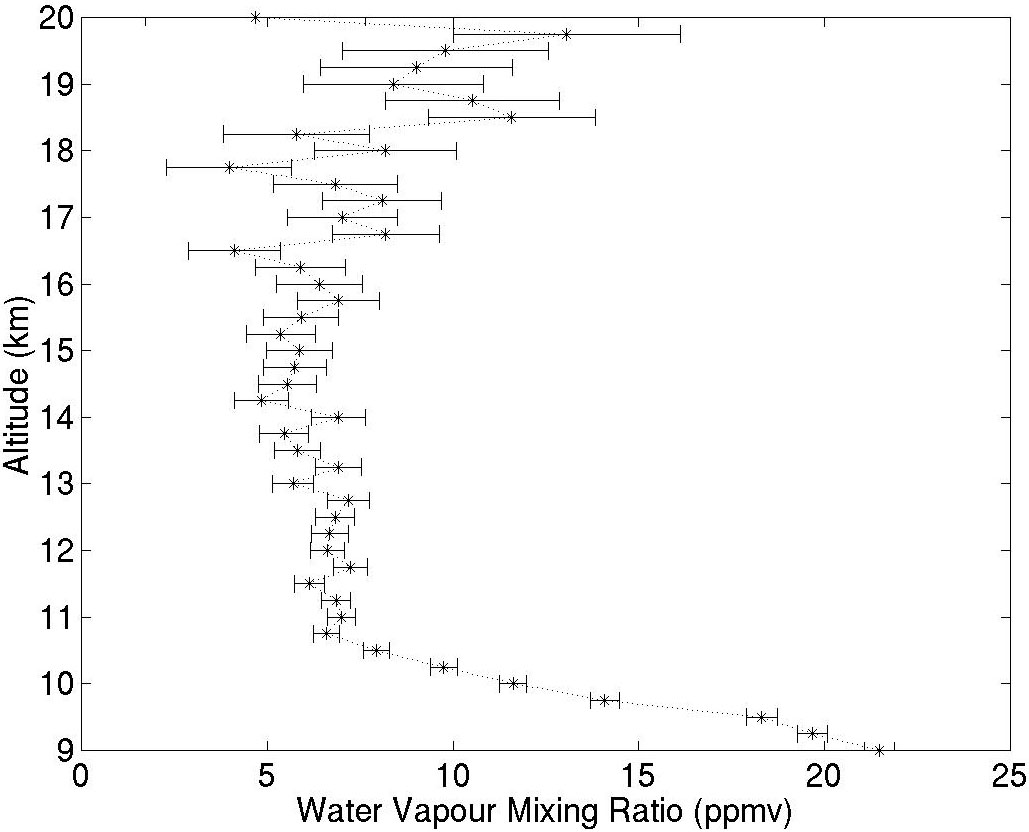 This figure was obtained on April 13, 1999. These stratospheric water vapour measurements done with a ground-based Raman lidar system are the first of their kind. This figure shows a profile of over 7 hours of data at 250 m vertical resolution. It uses a provisional calibration from a radiosonde launched from Detroit. Again, the system has no external calibration nor is the new system "tweaked" quite properly and so we expect greater results in the near future. A detailed calibration plan has been established and will be executed this summer. A microwave radiometer is being installed at the observatory and some balloon flights are expected as well. The radiometer will be checked against the radiosondes and the lidar will be checked against both methods of measurement. |